
Com(munity) As You Are: Buckling Up (pt. 2/4)
Let’s assume you’ve done your networking and you’ve visited a couple of events as outlined in Part 1 of this mini series. What’s next?
-
Twitter
What I did:
Two days after the Tableau Zen Master Days, I deleted my old Twitter account and created a new one. (Yes, I know you can simply change your handle, but I was not too keen on keeping my thirteen-year-old self’s ramblings out there in case anybody should actually bother to take a look at my profile. Instead you can now find my twenty-two-year-old’s ramblings about cutting all my hair off and why men’s belts are longer than women’s even though they’re supposed to be the same size if you scroll down far enough. Yay!) I began pushing content as much as I could. I don’t know what exactly it is that I did right, but I now have many more followers than I ever thought possible.
I also started reaching out to people who had written helpful blogs with the results those blogs helped me create. I thus tagged Matt Chambers in one of my first vizzes, because his was the most helpful blog post on tiled maps I could find at the time, and I had just created a trapezium tile map of Germany. Nothing I thought anyone might care about, but lo and behold, that viz was made Viz of the Day not forty-eight hours later. I don’t know if there was a connection, but this is what happened.
Viz of the Day: @TheHeidiK visualizes the relationship between crime severity and probation in Germany #VOTDhttps://t.co/5VOWXL3W1U
— Tableau Public (@tableaupublic) August 25, 2017
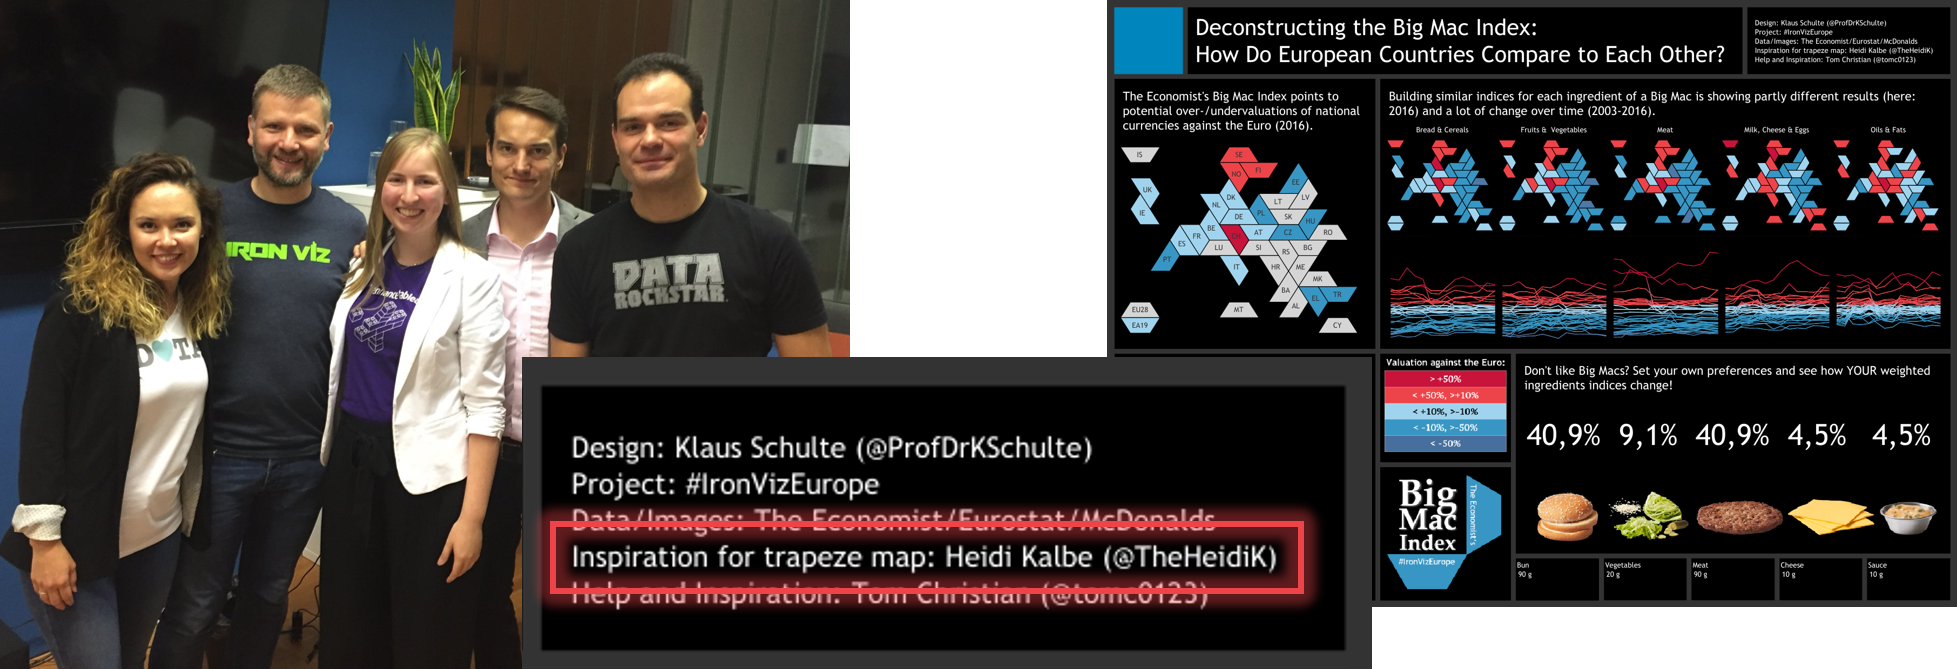
A year later, Klaus Schulte won Iron Viz Europe with his viz on the Big Mac Index, and he used a trapezium tile map – and he even gave credit in that viz. Together we were invited to speak at the Berlin TUG (circling back to 2. Events), and to this day Klaus is one of my favourite members in the Tableau Community.
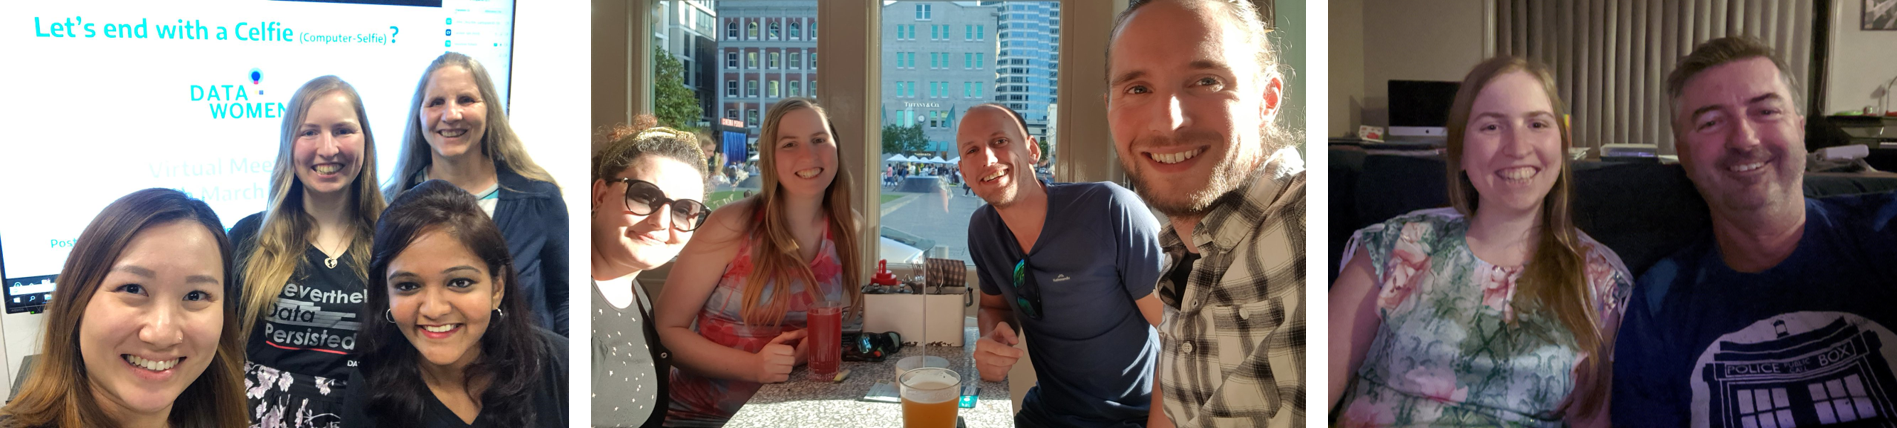
I have also made friends around the world via Twitter, many of whom I wouldn’t meet until years later at my first US conference, TC19 in Vegas. These friendships mean that I have plenty of people to visit and catch up with on my current journey around half the world, and it fills my heart to have this kind of family on the other side of the globe.
What you can learn from that:
Maybe you’re shy about talking to people face to face. Maybe you live in a remote location and there are no events near you. Maybe you just don’t like getting up from the couch. These things are no excuse to not engage with the Tableau Community. Use Twitter and tweet away! Bombard the community with your brilliance and reach out and find new friends. Ask for feedback and you shall receive. Give credit where credit is due, and it will be returned.
However: DO NOT tag people just to hitch a ride on their fame. It is not appreciated if you abuse the kindness of others for your own gain.
-
Tableau Public
What I did:
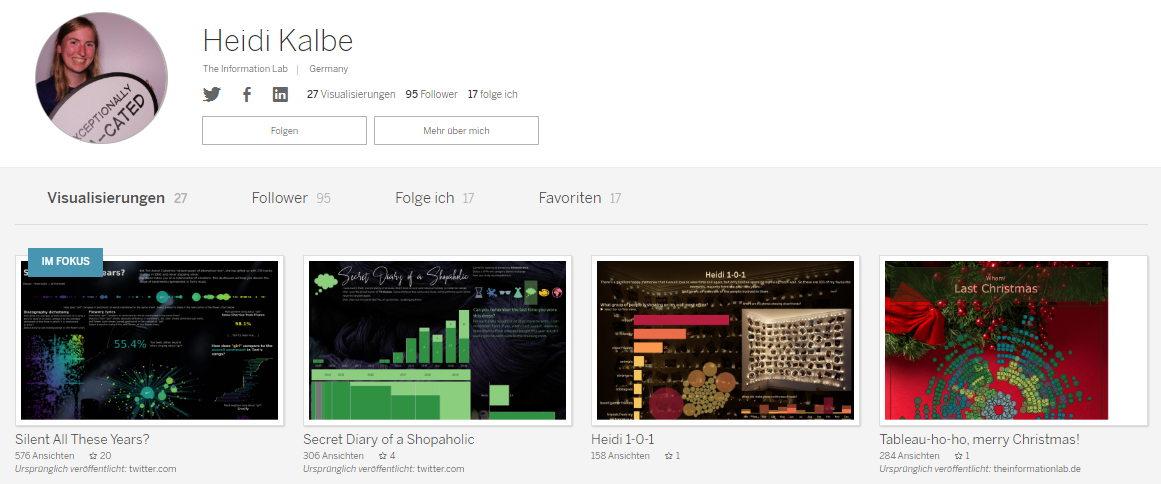
I first heard of MakeoverMonday for the very first time at the Tableau Zen Master Days. Two days later, I set up my Tableau Public profile and spent the whole weekend vizzing. By the end of the weekend, I had published my first four visualizations.
When I applied for a job at The Information Lab Germany a few weeks later, I included a link to my Tableau Public profile in my CV. This allowed me to skip a step in the application process. Seeing as I am still with The Information Lab two and a half years later, I would say that’s a definite benefit.
As a consultant, I care for a large number of different clients. Every now and then a client asks for proof of my skills. (Not in as many words, but the notion is clear.) Since I can hardly show dashboards I built for other clients, I introduce them to my Tableau Public profile. There they can leaf through my portfolio and find a number of diverse topics that I have visualized in Tableau. This will validate my skillset and set their minds at ease for our continued work.
When business users aren’t convinced that they will ever be able to live and breathe Tableau as easily as their IT colleagues, or if they fear that it will take them years and years with whatever background they have, I like to tell them the story of my first Viz of the Day. How frustration, determination, and a good deal of playfulness and curiosity won out, and I happened to create a whole new chart type (kind of) – after just three months of teaching myself Tableau. I show them my first Tableau Public vizzes, with the standard colour scales, and all bar charts, and little refined tooltips, and tell them that Tableau is a journey, and everyone can find their own paths. That usually helps.
What you can learn from that:
Publish away, delete nothing. Create a living portfolio that shows your development. Use it to convince employers and clients of your skills. Use it to tell the story of your own Tableau journey. And, as always: give credit where credit is due! Nobody likes a thief or a fraud.
Continue on to Part 3 of this mini series to learn about your next steps.