Public Speaking
I have had the opportunity to gain speaking experience through user groups, roundtables, panel discussions, community conferences, and even Tableau Conference. I have curated a number of presentations over the years, a list of which you will find below.
Are you looking for a speaker?
Contact me with information about the event you’re organizing and the kind of presentation you’re looking for. None of the topics below quite fit your event? Please don’t hesitate to contact me about a custom-made presentation.
Full list of presentations
The following topics are fully available and ready to go. Find abstracts, more information and recordings below. All presentations are available in English and can be translated into German (although I do love a good pun and those get usually lost in translation).
Conceptual topics:
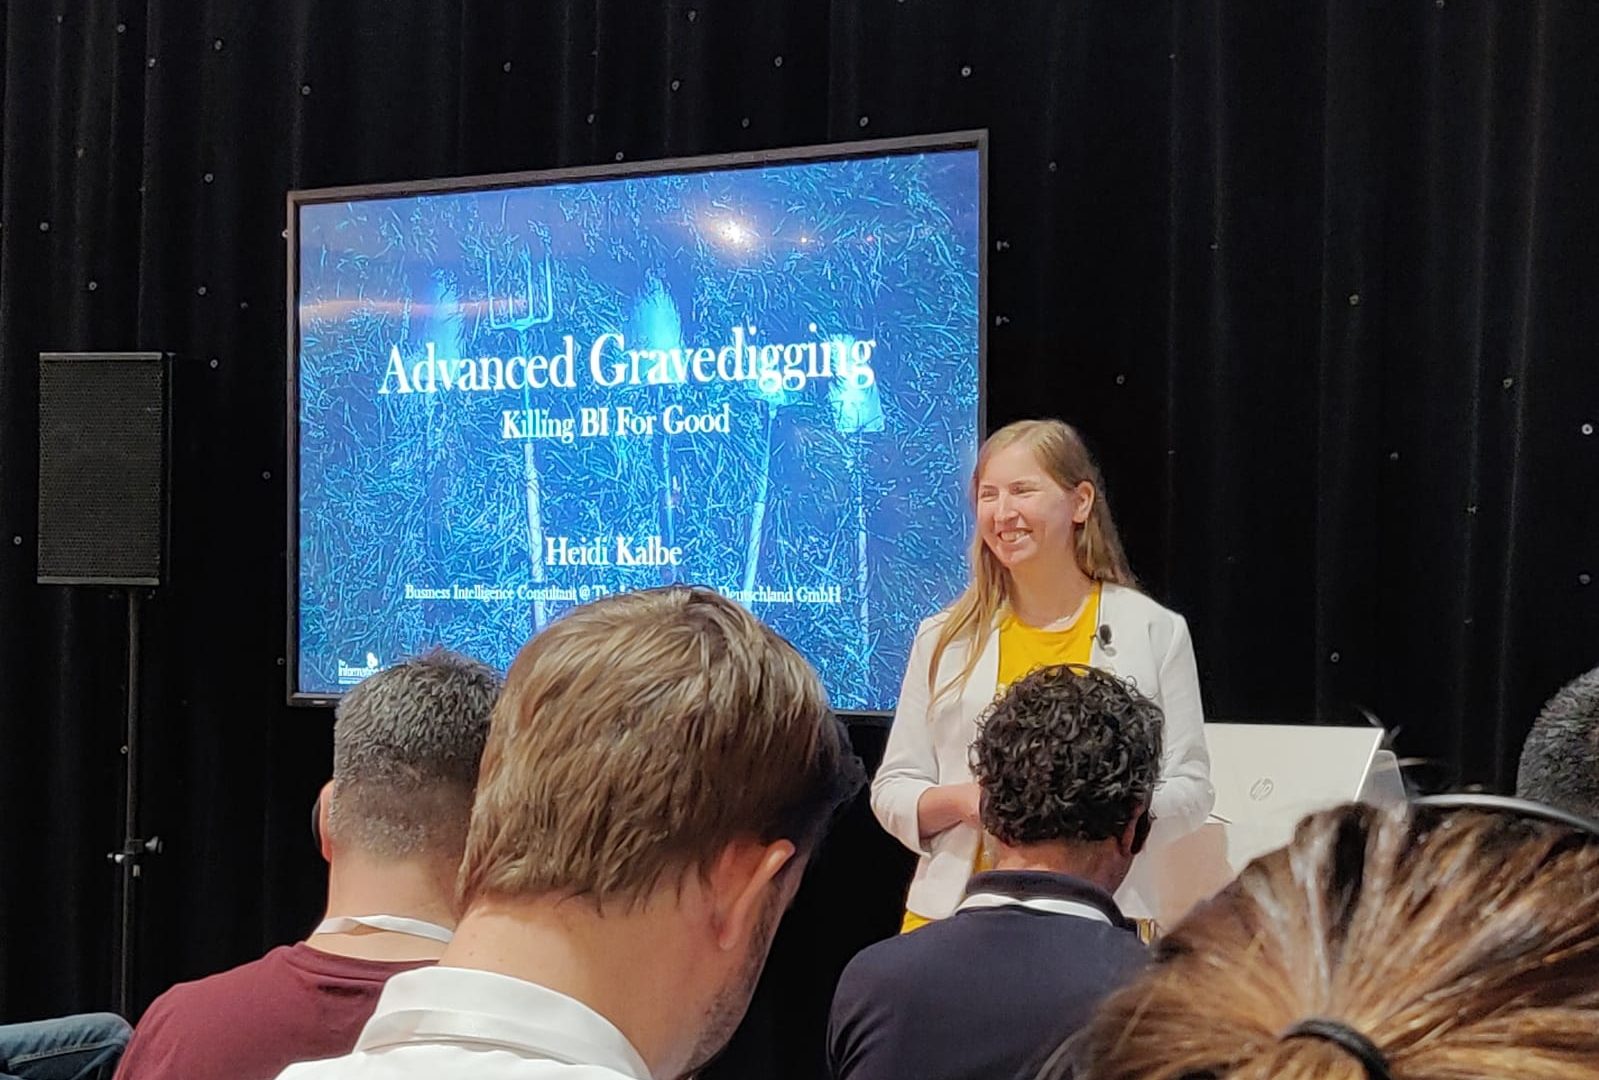
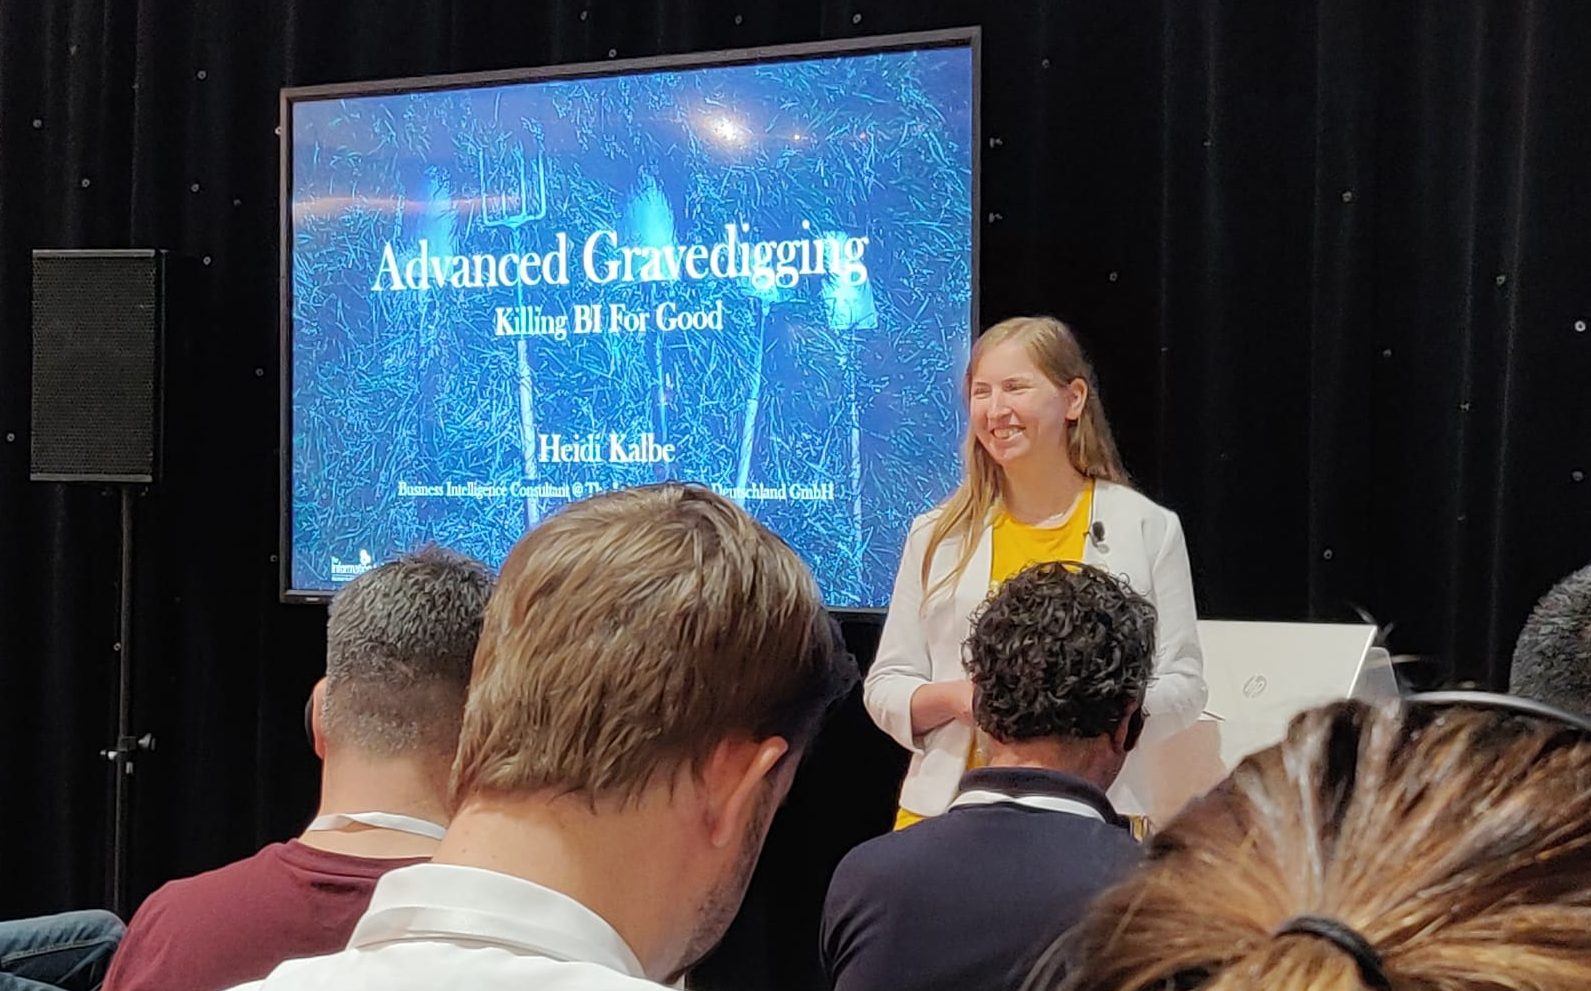
- Advanced Gravedigging: Killing BI For Good
- Run Before You Walk
- Com(munity) As You Are
Practical topics:
- Tableau Speed Tipping: 20 Tips In 20 Minutes
- Be Rational! Why Pi(e Chart) Is Not Your Answer
- Set It Up! When To Use Set Vs Parameter Actions
- The Secret To A Perfect Mari… mekko?
Conceptual topics
Advanced Gravedigging: Killing BI For Good
In data we trust – and yet there are many companies big and small that took data-driven decisions to their graves. Business Intelligence has been an eye opener, but where it should allow companies to fly, BI simply makes them run into the same brick walls, only now with their eyes wide open. Is it BI that is not all we were promised, or is it our understanding of BI that remains lacking? Is BI truly a do-or-die decision? And if yes, how can we “do” BI right and live to die another day?
Please note: Presented at Tableau Conference 2019 Europe. First sentences missing in recording.
Run Before You Walk
There is comfort in the stagnancy that static reports have to offer, but in this time of rapid progress, isn’t standard reporting terribly outdated? Oftentimes it can be difficult to leave the comfort of standardized reports in order to pursue the wealth of added value that individual user insights may provide. Jump-starting your way into the world of Self-Service BI may appear daring, but not if it is done correctly. In this session, you will learn about how to gain insights from your data, how to school data literacy, and how to maximize user acceptance. Dare to rise to the challenge of Self-Service BI and come out of this session an Olympic runner.
Please note: Available in English and German. Presented at TFF 2018 NorthAm, UK NorthWest TUG, and others.
Com(munity) As You Are
Data is about more than just crunching numbers and writing code and designing algorithms and fixing bugs. It’s also about us – about the community. The Tableau Community specifically is one of the most vibrant and welcoming technology communities in the world. But why is everybody so enchanted with it? And what’s in it for you? Hear about Heidi’s experiences and learn how the Tableau Community benefitted her – both professionally and personally. Follow her twelve steps to engage in your own community in order to propel yourself forward on your data journey.
Please note: Available in long (~20min) and short (~10min) version. Content available as a mini blog series (start here). Presented for Data+Women Singapore, London TUG, Athens TUG, and the Women In Data Symposium: Skills To Last A Decade. The below recording is of the short version of this talk.
Practical topics
Tableau Speed Tipping: 20 Tips in 20 Minutes
Can you learn twenty new Tableau hacks in just twenty minutes? Heidi will do her best to show you the little things that will make you go “Oh, I didn’t know this trick!” and save you a few seconds every day.
Please note: Contrary to the title, this talk takes about ~23min. Each tip is detailed on my blog (start here). This presentation is definitely one of the crowd favourites. Further speed tipping sessions are in the works. Presented for Data+Women Singapore, DataFamCommunityJam ep. 7, VizConnect, the internal RedHat APAC TUG, Netherlands TUG, and Athens TUG.
Be Rational! Why Pi(e Chart) Is Not Your Answer
Pi is an irrational number, meaning it has an infinite number of decimal places. Pies are delicious and some of us could irrationally eat them until infinity and beyond. Pie charts are often irrationally and unfittingly used, and the fight to show dashboard creators better practice chart types seems infinite. This session will tackle the irrational obsession that are pie charts, question their use and purpose, and introduce you to a number of infinitely better chart types.
Please note: This presentation is tool-agnostic and simply details best (and worst) practices around as well as alternatives to pie charts. Charts shown have been created in Tableau, but no Tableau-specific knowledge is imparted in this talk. This presentation is another crowd favourite. Available in English and German. Presented for TFF 2019 EMEA, Data+Women Singapore, Tableau Conference 2019 Europe, Hamburg TUG, and VizConnect.
Set It Up! When To Use Set Vs Parameter Actions
Tableau keeps rapidly publishing new features. Some of the biggest game changes amongst them were set actions and parameter actions. But when do you use which? And how can they help you visualize your business use cases? Watch this session to learn more.
Please note: Content is available in a mini blog series (start here). Presented at Tableau Conference-ish 2020, TFF 2019 NorthAm, and New Zealand TUG.
The Secret To A Perfect Mari… mekko?
Tired of simple bar charts? Try the Marimekko! Never heard of them? Might be because the Marimekko is one of the most undervalued chart types. Combining the relative and absolute values of a measure divided by two or more dimensions, the Marimekko helps you accomplish what mere stacked bar charts or pie charts fail to show. This session will not only teach you how to build a Marimekko, but also how to correctly use it to display your data in an engaging and insightful way.
Please note: Content available in mini blog series (start here) that was mentioned in Andy Cotgreave’s Best of the Tableau Web. Presented for TFF 2019 APAC.