Sorting a bar chart with multiple rows and columns
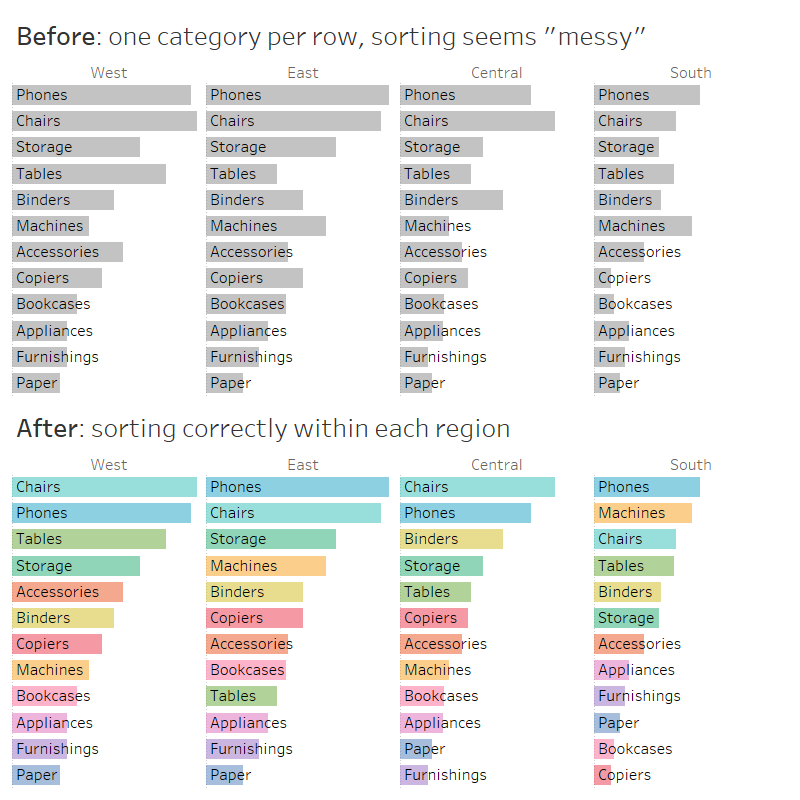
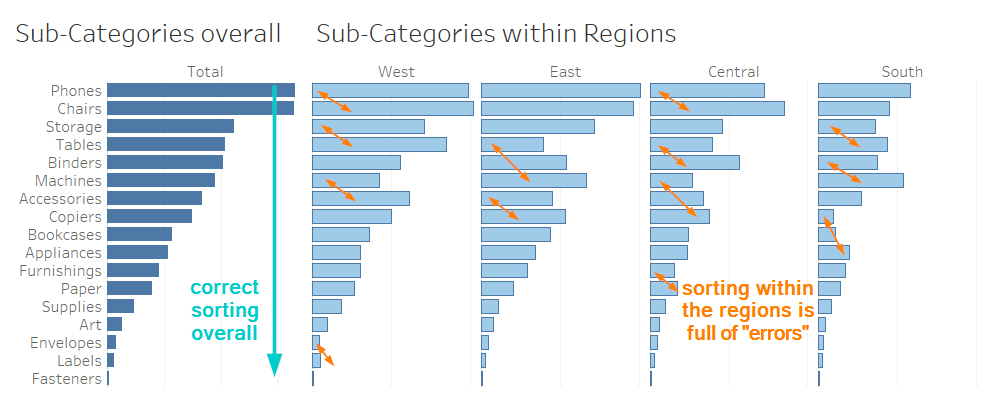
You have created a horizontal bar chart in Tableau which has multiple columns and multiple rows. You wish to sort your bars descendingly in each column, but Tableau won’t let you, because it only sorts your dimension on Rows by the aggregated measure instead of sorting each column individually. Let me help you there.
Why it cannot work as-is
Tableau arranges charts exactly the way you tell it to. If you drop a dimension onto Rows, you tell Tableau to have only values that fall into each element of that dimension within one row. Hence, you cannot sort the bars in each column individually as long as you have that dimension on Rows.
What you need to do
We need to create a new discrete field that we can put on Rows. This top row should contain only and all top values for each column, the second row should contain only and all second-highest values for each column, etc.
As you can probably guess, we will need a RANK table calculation for this. CTRL-drag your measure from Columns onto Detail in the Marks card. This way, we can fully set up our table calculation without Tableau constantly rearranging the view. Right-click and select the quick table calculation of rank. Right-click again and under “compute by”, select the dimension you have placed on Rows. Now right-click once more to change this pill to discrete.
Now drag this pill away from Detail onto Rows, and drag the dimension you first had on Rows away from Rows and onto Colour. This way, your consumers will be able to quickly tell which bars belong to the same category. Voilà! Tableau will now automatically sort your bars individually for each column.

Want to sort ascendingly? Change your rank calculation to rank ascendingly, and your bars will follow suit. Also, feel free to hide the headers of your rank calculation.
Find more tips like these in my Tableau Tip Battle with Annabelle Rincon at the Tableau Fringe Festival of December 2020: